고급기능 실시간 데이터를 JavaScript 스프레드시트에 통합하는 방법
페이지 정보
작성자 GrapeCity 작성일 2023-04-18 16:45 조회 272회
댓글 0건
작성일 2023-04-18 16:45 조회 272회
댓글 0건
본문
관련링크
주식, 날씨 및 스포츠 경기 점수 등과 같은 데이터는 계속해서 업데이트될 때 가장 유용합니다. SpreadJS는 데이터 바인딩을 통해 실시간 업데이트를 쉽게 사용, 표시 및 제공할 수 있는 매우 유용한 JavaScript 스프레드시트 컴포넌트입니다.
WebSocket을 사용해 Finnhub.IO에서 실시간 데이터를 가져오고, SpreadJS의 기본 기능으로 데이터를 보여줄 것입니다.
Finnhub Stock API를 활용하려면 무료 계정을 만들고 API 키를 생성해야 합니다. 이 키는 나중에 이 응용 프로그램에 추가됩니다.
이 튜토리얼에서는 WebSocket과 함께 Node.JS Express를 사용하므로 여기서 최신 버전을 설치해야 합니다. 또한 Visual Studio Code를 사용할 예정이므로 NPM 명령이 터미널에서 작동하도록 관리자로 실행해야 합니다.
이 튜토리얼용 샘플 압축 파일을 다운로드하십시오.
이 블로그에서는 하단의 단계에 따라 JavaScript 스프레드시트의 실시간 데이터를 통합하는 방법에 대해 설명할 것입니다.
- 응용 프로그램 설정
- 데이터 소스에 연결
- Spread에서 데이터 사용
- 꺾은 선형 차트에 데이터 추가
- 꺾은선형 차트 추가
- 프로그램 실행
응용 프로그램 설정
먼저 응용 프로그램을 위한 폴더를 만들겠습니다. 명칭은 "Real Time Data"로 지정했습니다. 다음으로, 폴더에서 프로젝트용 매니페스트 파일로 사용할 package.json 파일을 만들겠습니다. 아래와 유사한 내용이 여기에 포함될 수 있습니다.
{
    "name": "real-time-data",
    "version": "0.0.2",
    "description": "An app that imports real-time data into Spread JS",
    "dependencies": {}
}
이 응용 프로그램에서는 Express를 웹 프레임워크로 사용하고 WebSocket을 실시간 데이터로 사용할 것입니다. npm으로 간단하게 설치할 수 있으며, npm은 SpreadJS 파일을 설치할 때도 사용됩니다. Visual Studio Code 터미널에서 다음을 입력할 수 있습니다.
npm install --save express@4.18.2 finnhub websocket @grapecity/spread-sheets @grapecity/spread-sheets-charts
이 파일이 설치되면 응용 프로그램 설정에 사용할 "index.js" 파일을 만들 수 있습니다. 여기에는 하단 코드를 포함해야 합니다.
var express = require('express');
var app = express();
var http = require('http').Server(app);

app.use('/node_modules', express.static('node_modules'));

// Add code here

http.listen(3000, function(){
    console.log('Stock Ticker Started, connect to localhost:3000');
});
이제 응용 프로그램이 제공할 HTML 파일을 추가할 수 있습니다.
이 경우 파일 이름을 "index.html"로 지정할 수 있습니다. 먼저 SpreadJS에 대한 스크립트 및 CSS 참조와 다음과 같은 기본 초기화 코드를 포함하여 HTML 파일에 코드를 추가할 수 있습니다.
<!doctype html>
<html>
<head>
<title>Real Time Data</title>
</head>
<script type="text/javascript" src="stockTemplate.js"></script>
<link href="/node_modules/@grapecity/spread-sheets/styles/gc.spread.sheets.excel2013white.css" rel="stylesheet" type="text/css" />
<script src="/node_modules/@grapecity/spread-sheets/dist/gc.spread.sheets.all.min.js"></script>
<script src="/node_modules/@grapecity/spread-sheets-charts/dist/gc.spread.sheets.charts.min.js" ></script>
<script>
window.onload = function() {
// Initialize spread variables
var spread = new GC.Spread.Sheets.Workbook(document.getElementById("spreadSheet"), { sheetCount: 1 });
spread.fromJSON(stockTemplate);
spread.options.scrollbarMaxAlign = true;
spread.options.showHorizontalScrollbar = false;
spread.options.showVerticalScrollbar = false;
spread.options.grayAreaBackColor = 'rgb(38,38,38)';
var activeSheet = spread.getActiveSheet();
var dataSheet = spread.getSheet(1);
activeSheet.clearSelection();
}
</script>
<body>
<div id="spreadSheet" style="width: 680px; height: 590px; border: 1px solid gray"></div>
</body>
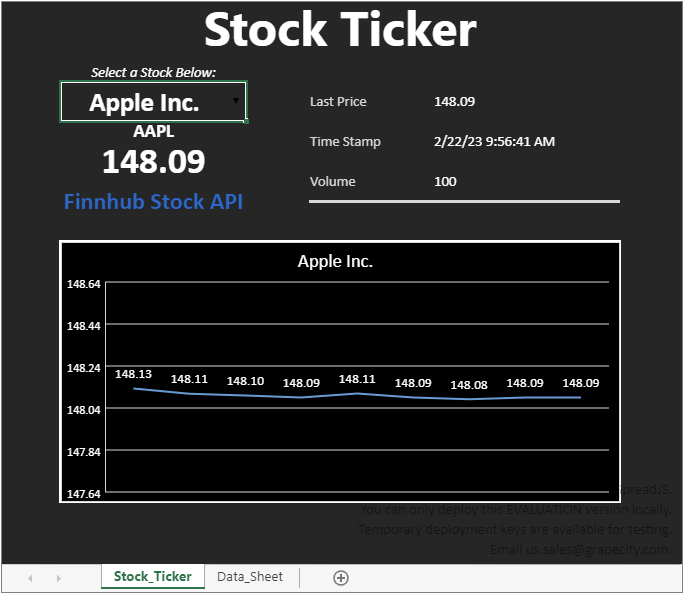
</html>이전 코드에서는 spread.fromJSON()을 사용하여 템플릿 파일을 로드했습니다. 이 프로젝트에서는 주식 시세 표시기의 기본 형식으로 사용할 템플릿 파일을 만들었습니다.
SpreadJS Designer만 사용하여 데이터 소스에 대한 데이터 레이블과 바인딩을 만들고 포맷된 셀, 제거된 눈금선, 헤더를 제거했으며 차트를 저장할 영역을 추가했습니다.
이 튜토리얼의 파일은 "stockTemplate.js"라고 합니다.
Designer에서 JS로 내보내려면 파일 > 내보내기를 클릭하고 "JavaScript 파일 내보내기"를 선택하세요. 이 튜토리얼의 템플릿 파일을 myindex.js 및 index.html 파일과 동일한 폴더에 저장했습니다.
index.js 파일에서 다음 코드를 사용하여 프로그램에 HTML 파일과 템플릿을 제공하도록 지시해야 합니다.
app.get('/', function(req, res){
    res.sendFile(__dirname + '/index.html');
});
// Required to load template file
app.get('/stockTemplate.js', function(req, res){
    res.sendFile(__dirname + '/stockTemplate.js');
});
index.html 파일로 돌아가서 스크립트를 추가하여 해당 템플릿 파일을 로드할 수 있습니다.
<script type="text/javascript" src="stockTemplate.js"></script>
설정을 마치기 위해 나중에 필요한 변수를 초기화하고 주식 선택을 위한 드롭다운 셀을 만들 수 있습니다.
// Initialize variables
var stockSymbolLookup = [{text:'Apple Inc.', value:'AAPL'}, {text:'Microsoft Inc.', value:'MSFT'}, {text:'Google', value:'GOOGL'}];
var dataSource = [],
    lastPrice = 0,
    timeStamp = 0,
    volume = 0,
    stockCounter = 0,
    chart = null,
    chartAxisRange = 0.5,
    lineDataMaxSize = 10,
    lineData = new Array(lineDataMaxSize),
    initialData = true,
    socket,
    stock;

// Create a drop down for selecting a stock
var stockDropDown = new GC.Spread.Sheets.CellTypes.ComboBox().items(stockSymbolLookup);
activeSheet.getCell(2,1).cellType(stockDropDown);
또한 공개 가격 변동에 대한 구체적인 조건부 형식을 설정할 수 있습니다.
녹색 = 양수
빨강 = 음수
// Set conditional formatting
function setConditionalFormatting() {
  var ranges = [new GC.Spread.Sheets.Range(8,1,1,1)];
  var lowerStyle = new GC.Spread.Sheets.Style();
  lowerStyle.foreColor = "red";
  activeSheet.conditionalFormats.addCellValueRule(
    GC.Spread.Sheets.ConditionalFormatting.ComparisonOperators.lessThan,
    -0.001,
    -0.001,
    lowerStyle,
    ranges
  );
  var upperStyle = new GC.Spread.Sheets.Style();
  upperStyle.foreColor = "green";
  activeSheet.conditionalFormats.addCellValueRule(
    GC.Spread.Sheets.ConditionalFormatting.ComparisonOperators.greaterThanOrEqualsTo,
    0.001,
    0.001,
    upperStyle,
    ranges
  );
}
데이터 소스에 연결
데이터 소스에 연결하기 위한 코드를 작성하기 전에, 사용자가 Spread의 드롭다운 목록에서 주식을 선택할 때 처리할 코드를 추가하고자 합니다.
이 작업을 수행해야만 데이터를 가져올 수 있습니다. EditEnded 이벤트에 바인딩하고 Lookup 배열에서 주식 기호를 조회한 다음 해당 주식으로 연결하면 됩니다.
// Bind an event for changing the stock in the drop down menu
// Set the stock variable to the newly selected stock from the list
activeSheet.bind(GC.Spread.Sheets.Events.EditEnded, function(e, info) {
  if(info.row === 2 && info.col === 1) {
    stock = stockSymbolLookup.find(stockLookup => stockLookup.text === activeSheet.getValue(2,1));
    connectToDataSource();
  }
});
이제 "connectToDataSource"라는 새로운 함수를 만들 수 있습니다.
// Handle connecting to the data source to get new stock information when the selected stock is changed
function connectToDataSource() {
  // Create a new WebSocket connected to the FinnHub Stock API with a personal token
  socket = new WebSocket('wss://ws.finnhub.io?token=<YOUR TOKEN HERE>');
  if (socket.readyState !== WebSocket.CLOSED)
    console.log("CONNECTED.");
  else
    console.log("NOT CONNECTED.");

  // When the socket first opens, set the length of the data source to zero, remove the line chart if
  // it exists, and send a message back to the server with the selected stock
  socket.addEventListener('open', function (event) {
    dataSource.length = 0;
    if (activeSheet.charts.get('line') != null)
      activeSheet.charts.remove('line');
    socket.send(JSON.stringify({'type':'subscribe', 'symbol':stock.value}));
  });
}
이 코드는 WebSocket을 사용하여 데이터 소스에 연결하고 구독할 주식 기호를 전달합니다.
참고: WebSocket,을 초기화할 때 ** Finnhub.IO에서 생성한 토큰을 추가합니다.
또한 "line"이라는 차트 제거 관련 섹션이 있는데, 이 기능은 주식 선택이 변경될 때마다 호출되므로 나중에 차트를 추가하면 차트를 재설정하는 데 사용됩니다.
프로그램이 데이터 소스에 연결되어 특정 주식 값을 구독하면 해당 데이터 소스로부터 JSON 데이터 형식으로 업데이트를 받습니다.
그리고 Spread에서 사용하려면 구문 분석이 필요합니다. 이를 수행하기 위해 이벤트 수신기를 사용하여 WebSocket에서 메시지를 수신할 수 있습니다.
// Listen for a message from the server
socket.addEventListener('message', function (event) {
  spread.suspendPaint();
  // Get the data from the server message
  var dataArray = JSON.parse(event.data)
  console.log(dataArray);
  if (dataArray.data && dataArray.data.length != 0) {
    // Set the data source and extract values from it
    var dataSource = dataArray.data[dataArray.data.length-1];
    lastPrice = dataSource.p;
    timeStamp = dataSource.t;
    volume = dataSource.v;
    // Fill in starting data for the line chart
    if (initialData) {
      lineData.fill({Value:lastPrice});
      setConditionalFormatting();
      initialData = false;
    }
    // Set the specific values in the spreadsheet
    activeSheet.setValue(4, 1, stock.value);
    activeSheet.setValue(5, 1, lastPrice);
    activeSheet.setValue(2, 7, lastPrice);
    activeSheet.setValue(4, 7, new Date(timeStamp));
    activeSheet.setValue(6, 7, volume);
    // Add the line chart if one doesn't exist
    if (activeSheet.charts.all().length == 0) {
      addChart();
    }
    addLineData(lastPrice);
    bindData();
  }

  spread.resumePaint();
});
위의 코드에서 데이터 소스를 살펴보고 시트에 샘플 데이터를 입력합니다. 또한 정의될 몇 가지 함수(bindData, addLineData, addChart 및 setConditionalFormatting)도 호출했습니다.
Spread에서 데이터 사용
각 함수를 사용하기 전에 프로그램의 주요 구조를 설명해야 합니다. 기본적으로 데이터는 셀 수준 데이터 바인딩을 통해 Spread 인스턴스 "Stock_Ticker"의 첫 번째 시트에 직접 바인딩되며, 관련 설명은 여기서 찾을 수 있습니다.
두 번째 시트는 프로그램 시작 이후 주식의 공개 가격 가치의 백로그입니다. 일반적으로 특정 날짜 이후 기록된 값을 추적하는 것이 가장 좋지만, 이 프로그램을 단순화하기 위해 프로그램 시작 시간을 기준으로 하며, 이 경우에는 가장 최근 값 10개만 기준으로 합니다.
꺾은선형 차트가 이러한 값의 백로그를 가리킬 것이며, 기본적으로 프로그램 시작 이후 값의 변화를 보여줍니다.
디자이너에 템플릿이 정의되어 있고 형식이 데이터 소스와 일치하는 경우, "bindData" 함수에서 호출된 setDataSource 함수를 사용하여 시트에서 설정할 수 있습니다.
또한 두 번째 시트인 "Data_Sheet"의 데이터 소스를 설정하고, 해당 시트의 형식에 상관없이 열 데이터에서 자동으로 생성되도록 할 수 있습니다.
// Bind the data source for both of the sheets
function bindData() {
  activeSheet.setDataSource(new GC.Spread.Sheets.Bindings.CellBindingSource(dataSource));
  dataSheet.autoGenerateColumns = true;
  dataSheet.setDataSource(lineData);
}
꺾은선형 차트에 데이터 추가
다음으로 정의할 함수는 "addLineData" 함수입니다. 이 함수는 본 튜토리얼의 앞부분에서 정의한 배열을 사용하며, 이전 값과 다른 경우 데이터 소스에서 새 값이 수신될 때마다 해당 값에 추가합니다.
// Add data with each update for the line chart
function addLineData(lastPrice) {
  if (lineData.length >= lineDataMaxSize)
    lineData.shift();
  stockCounter++;
  // Only add the data to the list for the line chart if the data has changed
  if (lastPrice != lineData[lineData.length-1].Value) {
    lineData.push({ Value:lastPrice });
  }
}
꺾은선형 차트 추가
lineData 데이터 소스에 바인딩된 "Data_Sheet" 시트에서 셀 범위를 지정하여 꺾은선형 차트를 작성할 수 있습니다. 또한 "addChart" 함수의 제목, 축, 데이터 레이블, 범례 및 차트 영역의 형식을 변경할 수도 있습니다.
// Add the line chart
function addChart() {
  // Define the area to load the chart into
  var startCellRect = activeSheet.getCellRect(11, 1);
  var endCellRect = activeSheet.getCellRect(24, 9);
  var chartStart = {
    x: startCellRect.x,
    y: startCellRect.y
  };
  var chartArea = {
    width: endCellRect.x-startCellRect.x,
    height: endCellRect.y-chartStart.y
  }
  chart = activeSheet.charts.add('line',
    GC.Spread.Sheets.Charts.ChartType.line,
    chartStart.x,
    chartStart.y,
    chartArea.width,
    chartArea.height,
    'Data_Sheet!$A$1:$A$' + lineDataMaxSize
  );

  chart.allowMove(false);

  // Set the title of the chart
  chart.title({
    text: activeSheet.getValue(2,1),
    color: "white"
  });

  // Change the values on the y-axis to show changes easier
  // Hide the x-axis values, we only care about changes, not specific time values
  chart.axes({
    primaryValue: {
      min: openPrice - chartAxisRange,
      max: openPrice + chartAxisRange
    },
    primaryCategory: {
      visible: false
    }
  });

  // Add data labels to the chart
  chart.dataLabels({
    color: "white",
    format: "0.00",
    position: GC.Spread.Sheets.Charts.DataLabelPosition.above,
    showValue: true
  });

  // Hide the legend; there is only one series used in this chart
  chart.legend({
    visible: false
  });

  // Change the color of the chart
  chart.chartArea({
    backColor: "black",
    color: "white"
  })
}
프로그램 실행
모든 코드가 추가되면 프로그램 실행이 쉬워집니다.
Visual Studio Code에서 터미널을 열고 다음을 입력합니다.
node index.js
그런 다음 웹 브라우저에서 localhost:3000으로 이동합니다.
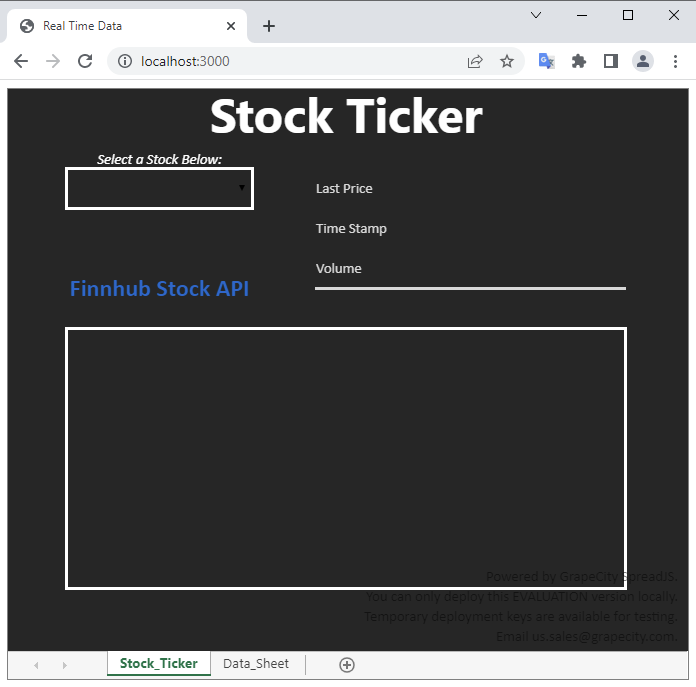
드롭다운 메뉴에서 주식을 선택하여 데이터를 로드합니다.

SpreadJS에서 실시간 데이터 소스를 사용하는 간단한 예이지만, 이는 여러 가지 방법으로 수행 가능합니다.
SpreadJS에서 차트와 데이터 바인딩 기능이 추가되어 데이터를 표시하는 것 이상의 작업을 수행할 수 있습니다.
지금 바로 SpreadJS를 다운로드하여 직접 테스트해 보세요!

댓글목록
등록된 댓글이 없습니다.