Angular대시보드 반응형 Angular 대시보드 3부: 맵 컨트롤로 지리 데이터 표시
페이지 정보
작성자 GrapeCity 작성일 2023-09-06 15:48 조회 204회
댓글 0건
작성일 2023-09-06 15:48 조회 204회
댓글 0건
본문
첨부파일
관련링크
2부에서는 대시보드 맨 위에 표시되는 정보 카드와 세션, 브라우저 및 플랫폼 정보를 표시하는 FlexChart와 국가별 방문자 비율에 관한 정보를 표시하는 Linear Gauge(선형 게이지)를 구축했습니다.
이번 3부에서는 국가별 사용자에 대한 시각적 정보를 표시하는 FlexMap과 맵에서 사용자가 특정 국가를 클릭할 때 추가 정보를 표시하는 FlexGrid를 구현할 것입니다.
FlexMap
대시보드에서 구현한 수많은 컨트롤은 순수하게 사용자가 볼 수 있도록 데이터를 표시하는 역할을 하는 반면, FlexMap은 대시보드의 기본 대화형 부분 역할을 합니다.
사용자는 연관된 데이터가 있는 각 국가를 마우스로 가리킬 수 있습니다.
사용자가 국가를 클릭하면 FlexGrid(3부 뒷부분에서 구현할 예정)가 업데이트되어 해당 국가의 정보를 표시합니다.
먼저, FlexMap이 포함된 컴포넌트를 생성해야 합니다. 컴포넌트의 이름은 map-info로 하겠습니다.
ng g c map-info
다음으로, map-info.component.html 내에서 마크업을 구현해야 합니다.
<wj-flex-map #flexMap header="Breakdown by Country" [tooltipContent]="tooltipContent" [selectionMode]="2" style="height: 100%;">
    <wj-geo-map-layer #geoLayer url="../assets/custom.geo.json" (itemsSourceChanged)="initializeMap(geoLayer)">
      <wj-color-scale #colorScale [colors]="colors" [binding]="binding" [scale]="scale"></wj-color-scale>
    </wj-geo-map-layer>
</wj-flex-map>
보시다시피, 몇 줄의 코드만으로도 복잡한 대화형 맵을 구현하실 수 있습니다.
이 마크업이 FlexMap 컨트롤을 생성하는 동안 맵에는 실제로 세 개의 개별 컴포넌트인 FlexMap, GeoMapLayer, ColorScale이 사용됩니다.
FlexMap: 표시되는 맵과 사용자가 맵의 여러 섹션을 마우스로 가리키면 표시되는 Tooltip이 포함된 창 생성
GeoMapLayer: GeoJSON을 사용하여 맵을 그리고 컨트롤을 초기화
ColorScale: 색상이 지정될 국가 및 그리드에 바인딩될 색상을 바인딩하는 데 사용
이 응용 프로그램의 경우 assets/custom.geo.json 파일 내에서 맵을 작성하는 데 사용하는 GeoJSON을 저장했습니다.
소스 코드를 다운로드하여 파일과 애플리케이션을 확인해 보시길 바랍니다.
코드를 사용하여 컴포넌트에 필요한 필수 데이터와 메서드가 포함된 data.service.ts 파일을 준비해 보겠습니다.
  countryData = [
    {
      Country: 'United States',
      AverageResponseTime: '1.2000',
      PageViews: '21.9k',
      IssuesReported: '72',
    },
    {
      Country: 'Canada',
      AverageResponseTime: '1.4250',
      PageViews: '12.7k',
      IssuesReported: '35',
    },
    {
      Country: 'Mexico',
      AverageResponseTime: '1.5500',
      PageViews: '4.2k',
      IssuesReported: '24',
    },
    {
      Country: 'Brazil',
      AverageResponseTime: '2.6505',
      PageViews: '1.3k',
      IssuesReported: '7',
    },
    {
      Country: 'Peru',
      AverageResponseTime: '3.2400',
      PageViews: '0.8k',
      IssuesReported: '2',
    },
    {
      Country: 'United Kingdom',
      AverageResponseTime: '1.7500',
      PageViews: '7.9k',
      IssuesReported: '29',
    },
    {
      Country: 'France',
      AverageResponseTime: '1.9000',
      PageViews: '3.4k',
      IssuesReported: '19',
    },
    {
      Country: 'Germany',
      AverageResponseTime: '2.1000',
      PageViews: '5.6k',
      IssuesReported: '15',
    },
    {
      Country: 'Spain',
      AverageResponseTime: '2.2500',
      PageViews: '2.3k',
      IssuesReported: '9',
    },
    {
      Country: 'Italy',
      AverageResponseTime: '2.3500',
      PageViews: '1.9k',
      IssuesReported: '6',
    },
    {
      Country: 'Netherlands',
      AverageResponseTime: '1.9250',
      PageViews: '0.9k',
      IssuesReported: '4',
    },
    {
      Country: 'Finland',
      AverageResponseTime: '2.0150',
      PageViews: '1.1k',
      IssuesReported: '7',
    },
    {
      Country: 'Denmark',
      AverageResponseTime: '3.5025',
      PageViews: '1.8k',
      IssuesReported: '9',
    },
    {
      Country: 'Norway',
      AverageResponseTime: '2.7500',
      PageViews: '2.1k',
      IssuesReported: '14',
    },
    {
      Country: 'Poland',
      AverageResponseTime: '3.4000',
      PageViews: '0.3k',
      IssuesReported: '3',
    },
    {
      Country: 'Russia',
      AverageResponseTime: '2.2250',
      PageViews: '5.9k',
      IssuesReported: '11',
    },
    {
      Country: 'Ukraine',
      AverageResponseTime: '3.2500',
      PageViews: '3.1k',
      IssuesReported: '8',
    },
    {
      Country: 'China',
      AverageResponseTime: '2.7000',
      PageViews: '11.3k',
      IssuesReported: '18',
    },
    {
      Country: 'Japan',
      AverageResponseTime: '2.3000',
      PageViews: '13.8k',
      IssuesReported: '17',
    },
    {
      Country: 'Australia',
      AverageResponseTime: '3.1000',
      PageViews: '2.4k',
      IssuesReported: '7',
    },
  ];

  getCountryData() {
    return this.countryData;
  }

  isValidCountry(countryName: string): boolean {
    for (var i = 0; i < this.countryData.length; i++) {
      if (this.countryData[i].Country == countryName) {
        return true;
      }
    }
    return false;
  }
app.component.ts에 하단의 코드를 사용하여 업데이트하겠습니다.
selectedCountryName: string;

countryName(e: any) {
    this.selectedCountryName = e;
  }
마크업이 작성되었으므로, map-info.component.ts 파일로 이동합니다.
사용자가 FlexMap과 상호 작용을 허용하는 TypeScript를 작성하고 섹션 별로 분류하겠습니다.
import { Component, OnInit, Output, ViewChild, EventEmitter } from '@angular/core';

import { Palettes } from "@grapecity/wijmo.chart";
import { FlexMap } from '@grapecity/wijmo.chart.map';
import { DataService } from '../data.service';

@Component({
  selector: 'app-map-info',
  templateUrl: './map-info.component.html',
  styleUrls: ['./map-info.component.css']
})
export class MapInfoComponent implements OnInit {}
여기서는 사용할 여러 라이브러리 패키지를 모두 가지고 옵니다.
Wijmo에서는 Palettes를 사용하여 맵 및 FlexMap 색상을 지정합니다.
이는 맵에서 데이터를 검색하는 컨트롤에 엑세스할 수 있습니다.
Tooltip을 채우는 데 사용할 수 있는 데이터를 검색하기 위해 DataService를 가지고 옵니다.
ViewChild, EventEmitter, Output을 가지고 와 마크업에서 정보를 끌어옵니다.
다른 컴포넌트(우리의 경우, 구현 예정인 FlexGrid)로 데이터를 내보냅니다.
다음으로, 컴포넌트에서 사용할 속성을 살펴보겠습니다.
@ViewChild('flexMap') flexMap: FlexMap;
@Output() countryName = new EventEmitter<string>();
flexMapData: any;
dataMap = new Map();
pageViewMap = new Map();
issuesReportedMap = new Map();
colors = Palettes.Diverging.RdYlGn;
selectedColor: '#188d9b';
selectedCountry: '';
selectedID: any;
hitTestInfo: any;
binding = (o: any) => this.dataMap.get(o.properties.name);
scale = (v: number) => 1 - v;
tooltipContent = (f: any) => this.getCountryToolTip(f);
- flexMap: FlexMap 컨트롤에 대한 참조를 보유
countryName: 선택한 국가 이름을 FlexGrid 컨트롤로 내보내는 데 사용
flexMapData: 데이터 서비스에서 국가별 데이터를 보유
dataMap: 각 국가에 색상 값을 할당하는 데 사용할 데이터 배열을 작성하기 위해 사용
pageViewMap: Tooltip에 표시되며 각 국가에 대한 총 페이지 조회수 보유
issuesReportedMap: Tooltip에 표시되며 각 국가에 대해 보고된 문제 수를 보유
colors: ColorScale 컴포넌트로 전달되어 국가의 색을 지정하는 데 사용되는 색상 값 배열을 보유
selectedColor: 사용자가 클릭하는 국가의 색상 값을 설정
selectedCountry: 사용자가 클릭한 국가의 문자열 값을 가져오는 데 사용
selectedID: 사용자가 클릭한 국가의 ID 값을 가져오는 데 사용
binding: FlexMap에서 색상이 지정될 여러 국가를 바인딩하는 데 사용되는 값 배열을 보유
scale(척도): 각 국가에 할당될 색상을 선택하는 데 사용
tooltipContent: 사용자가 국가를 마우스로 가리키면 표시되는 각 국가에 대한 Tooltip을 작성
이 파일에서 살펴볼 코드의 다음 섹션은 컴포넌트 초기화 시, FlexMap 컨트롤 생성 시, Tooltip 생성 시, 그리고 사용자가 국가를 클릭할 때 국가 이름 값을 내보내기 위해 호출되는 네 가지 메서드입니다.
먼저 ngOnInit() 메서드에 대해 살펴보겠습니다.
ngOnInit() {
    this.flexMapData = this.dataService.getCountryData();
    Array.prototype.forEach.call(this.flexMapData, el => {
        this.dataMap.set(el.Country, parseFloat(el.AverageResponseTime));
        this.pageViewMap.set(el.Country, el.PageViews);
        this.issuesReportedMap.set(el.Country, parseInt(el.IssuesReported));
    });
}
ngOnInit() 메서드 내부에서는 맵 컨트롤의 여러 영역에 데이터를 할당하는 데 사용할 FlexMap의 데이터 소스를 설정합니다.
맵 컨트롤이 측정하려는 데이터를 기반으로 맵의 각 영역에 색상을 지정할 수 있습니다.
* 이번 샘플에서는 응답 시간(AverageResponseTime)을 사용했습니다.
또한 세 가지 맵 dataMap, pageViewMap, issuesReportedMap의 값을 설정합니다.
세 가지 맵은 맵 색상을 지정하고 사용자가 국가를 마우스로 가리킬 때 표시되는 Tooltip을 작성하는 데 사용됩니다.
다음으로, FlexMap이 초기화될 때 호출되는 메서드를 설정합니다.
initializeMap(layer: any) {
    this.flexMap.zoomTo(layer.getGeoBBox());
    this.flexMap.hostElement.addEventListener('mousedown', (e) => {
      this.hitTestInfo = this.flexMap.hitTest(e);
      if(this.hitTestInfo._item !== undefined) {
        this.emitCountryName(this.hitTestInfo._item.name);
        let el = document.elementFromPoint(e.x, e.y);
        let id = el ? el.getAttribute('wj-map:id') : undefined;
        this.selectedID = id;
        this.flexMap.invalidate(true);
      }
    });
    this.flexMap.rendered.addHandler((s, a) => {
        const layer = this.flexMap.layers[0];
        const g = layer._g;
        if(g && this.selectedID && this.validCountry(this.hitTestInfo._item.name)) {
            let list = [];
            for(let i = 0; i < g.childNodes.length; i++) {
                const node = g.childNodes[i];
                let id = node.getAttribute('wj-map:id');
                if(id === this.selectedID) {
                    node.setAttribute('fill', this.selectedColor);
                    list.push(node);
                }
            }
            list.forEach((el) => el.parentNode.appendChild(el));
        }
    });
}
initializeMap() 메서드는 mousedown 이벤트를 맵에 연결하는 데 사용됩니다.
그런 다음 hitTest() 메서드를 사용하여 사용자가 맵에서 클릭하는 위치를 추적합니다.
사용자가 클릭한 국가에 국가와 관련된 값이 있는 경우 emitCountryName() 메서드를 호출하여 사용자가 클릭한 국가의 이름이 포함된 이벤트를 내보냅니다.
또한 이벤트를 맵의 rendered 이벤트에 연결합니다.
이 연결을 사용하여 사용자가 클릭한 국가의 값을 바탕으로 선택한 국가를 설정합니다.
유효한 ID가 있고, 선택한 국가(데이터 내 값을 포함하는 국가)가 유효한지 확인합니다.
유효한 경우 응용 프로그램에서 먼저 정의한 selectedColor를 사용하여 해당 영역을 채웁니다.
마지막으로, emitCountry(), getCountryToolTip() 및 validCountry() 메서드를 만듭니다.
emitCountryName(value: string) {
    this.countryName.emit(value);
}

getCountryToolTip(val: any): string {
    if(this.dataService.isValidCountry(val.name)) {
        return `<b>` + val.name + `</b><br>` + 'Average Response Time: ' + this.dataMap.get(val.name) + 's' + `<br>` + 'Page Views: ' + this.pageViewMap.get(val.name) + `<br>` + 'Issues Reported: ' + this.issuesReportedMap.get(val.name);
    }
    return `<b>` + val.name + `</b><br>` + 'No data available';
}

validCountry(value: string) {
    for(var i = 0; i < this.flexMapData.length; i++) {
        if(this.flexMapData[i].Country == value) {
            return true;
        }
    }
    return false;
}
- emitCountry() 메서드: 국가 이름 값을 가져와 내보내기
- FlexGrid를 사용하는 컴포넌트와 함께 이 값을 사용하여 해당 국가와 연관된 데이터를 가져옵니다.
- getCountryTooltip() 메서드: 사용자가 맵에서 여러 국가를 마우스로 가리킬 때 렌더링되는 HTML을 작성하는 데 사용
- validCountry() 메서드: 값을 가져와 선택한 국가가 "유효한" 국가인지 결정하고 관련 데이터가 있는 국가 중 하나인지 확인
- getCountryToolTip() 메서드: 표시되는 Tooltip을 작성하는 데 사용
- Tooltip에서는 국가 이름, 국가의 평균 응답 시간, 국가에 대한 페이지 조회수, 해당 국가에 대해 보고된 문제 수를 표시합니다.
다음은 TypeScript 파일의 완성 버전입니다.
import { Component, OnInit, Output, ViewChild, EventEmitter } from '@angular/core';

import { Palettes } from "@grapecity/wijmo.chart";
import { FlexMap } from '@grapecity/wijmo.chart.map';
import { DataService } from '../data.service';

@Component({
  selector: 'app-map-info',
  templateUrl: './map-info.component.html',
  styleUrls: ['./map-info.component.css']
})
export class MapInfoComponent implements OnInit {
  @ViewChild('flexMap') flexMap: FlexMap;
  @Output() countryName = new EventEmitter<string>();
  flexMapData: any;
  dataMap = new Map();
  pageViewMap = new Map();
  issuesReportedMap = new Map();
  colors = Palettes.Diverging.RdYlGn;
  selectedColor: '#188d9b';
  selectedCountry: '';
  selectedID: any;
  hitTestInfo: any;   binding = (o: any) => this.dataMap.get(o.properties.name);
  scale = (v: number) => 1 - v;
  tooltipContent = (f: any) => this.getCountryToolTip(f);

  constructor(private dataService: DataService){}

  ngOnInit() {
    this.flexMapData = this.dataService.getCountryData();
    Array.prototype.forEach.call(this.flexMapData, el => {
      this.dataMap.set(el.Country, parseFloat(el.AverageResponseTime));
      this.pageViewMap.set(el.Country, el.PageViews);
      this.issuesReportedMap.set(el.Country, parseInt(el.IssuesReported));
    });
  }

  initializeMap(layer: any) {
    this.flexMap.zoomTo(layer.getGeoBBox());
    this.flexMap.hostElement.addEventListener('mousedown', (e) => {
      this.hitTestInfo = this.flexMap.hitTest(e);
      if(this.hitTestInfo._item !== undefined) {
        this.emitCountryName(this.hitTestInfo._item.name);
      let el = document.elementFromPoint(e.x, e.y);
      let id = el ? el.getAttribute('wj-map:id') : undefined;
      this.selectedID = id;
      this.flexMap.invalidate(true);
    }});
    this.flexMap.rendered.addHandler((s, a) => {
      const layer = this.flexMap.layers[0];
      const g = layer._g;
      if(g && this.selectedID && this.validCountry(this.hitTestInfo._item.name)) {
        let list = [];
        for(let i = 0; i < g.childNodes.length; i++) {
          const node = g.childNodes[i];
          let id = node.getAttribute('wj-map:id');
          if(id === this.selectedID) {
            node.setAttribute('fill', this.selectedColor);
            list.push(node);
          }
        }
        list.forEach((el) => el.parentNode.appendChild(el));
      }
    });
  }

  emitCountryName(value: string) {
    this.countryName.emit(value);
  }

  getCountryToolTip(val: any): string {
    if(this.dataService.isValidCountry(val.name)) {
      return `<b>` + val.name + `</b><br>` + 'Average Response Time: ' + this.dataMap.get(val.name) + 's' + `<br>` + 'Page Views: ' + this.pageViewMap.get(val.name) + `<br>` + 'Issues Reported: ' + this.issuesReportedMap.get(val.name);
    }
    return `<b>` + val.name + `</b><br>` + 'No data available';
  }

  validCountry(value: string) {
    for(var i = 0; i < this.flexMapData.length; i++) {
      if(this.flexMapData[i].Country == value) {
        return true;
      }
    }
    return false;
  }
}
이제 app.component.html 파일 내에 map-info 컴포넌트를 추가하면 됩니다.
 <div class="livemap map">
    <app-map-info (countryName)="countryName($event)"></app-map-info>
  </div>
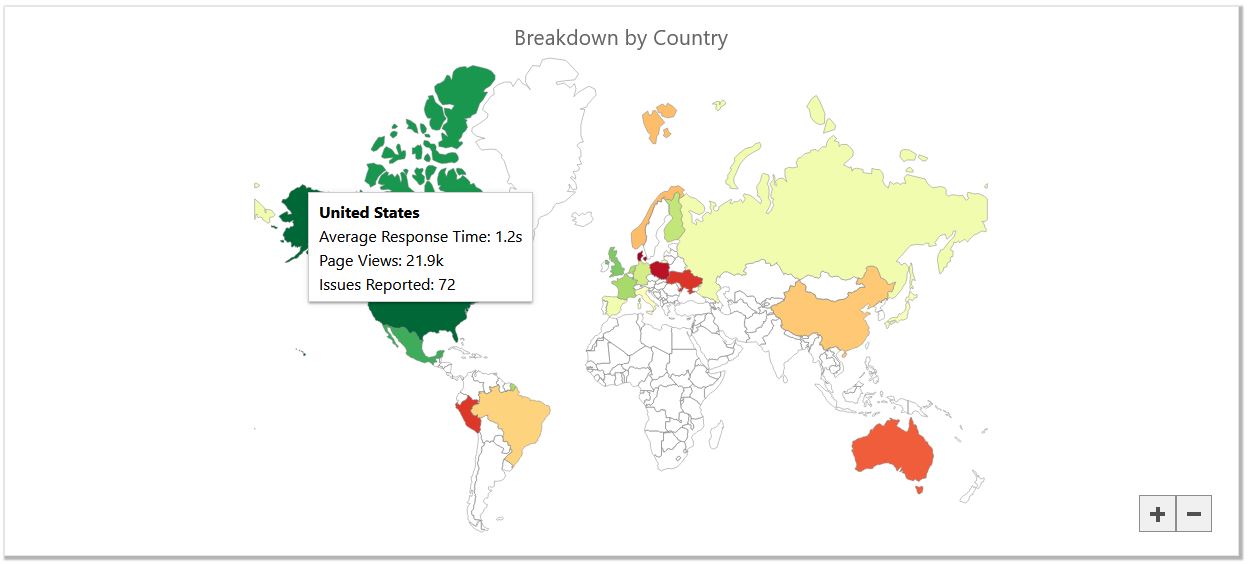
응용 프로그램을 실행하면 다음 내용을 볼 수 있습니다.
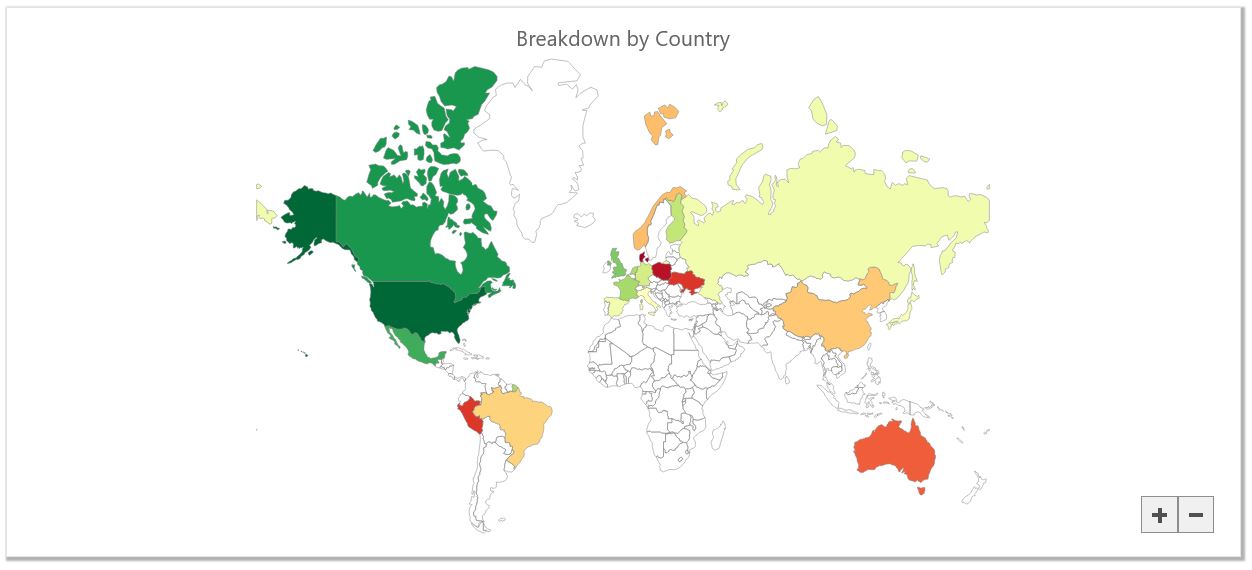
사용자가 국가를 마우스로 가리키면 관련 데이터가 포함된 Tooltip이 표시됩니다.
FlexMap 컨트롤을 구현하는 방법에 대해 알아보았습니다.
다음으로 FlexGrid를 포함한 대시보드 카드를 구현하는 프로세스를 살펴보겠습니다.
FlexGrid
다음으로 우리가 해야 할 일은 FlexGrid 및 선택한 국가와 관련된 데이터를 표시하는 데 사용할 두 가지 컴포넌트를 구현하는 것입니다.
다음 명령을 실행해 주세요.
ng g c user-info
ng g c issue-info
첫 번째로 user-info 컴포넌트를 살펴보겠습니다.
이 컴포넌트는 사용자가 선택한 국가에서 당사 사이트를 방문한 최근 200명의 사용자에 대한 데이터를 수집하고 표시합니다.
기본적으로 미국에서 방문하는 사용자의 데이터가 표시됩니다.
먼저 user-info.component.html 파일을 살펴보겠습니다.
<div class="users-container">
    <div class="users-header">RECENT USERS <i class="bi bi-question-circle" [wjTooltip]="usersTooltip" [wjTooltipPosition]="6"></i></div>
    <wj-flex-grid [itemsSource]="selectedCountryData" [isReadOnly]="true" [selectionMode]="'Row'" [headersVisibility]="'Column'">
        <wj-flex-grid-column binding="country" header="Country" [width]="'*'"></wj-flex-grid-column>
        <wj-flex-grid-column binding="sessionDuration" header="Session Duration"></wj-flex-grid-column>
        <wj-flex-grid-column binding="ipAddress" header="IP Address"></wj-flex-grid-column>
        <wj-flex-grid-column binding="platform" header="Platform">
            <ng-template wjFlexGridCellTemplate [cellType]="'Cell'" let-cell="cell">
                <i *ngIf="cell.item.platform == 'Desktop'" class="bi bi-display-fill"></i>
                <i *ngIf="cell.item.platform == 'Mobile'" class="bi bi-phone-fill"></i>
                <i *ngIf="cell.item.platform == 'Tablet'" class="bi bi-tablet-landscape-fill"></i>
                <i *ngIf="cell.item.platform == 'Other'" class="bi bi-terminal-fill"></i>
                {{cell.item.platform}}
            </ng-template>
        </wj-flex-grid-column>
        <wj-flex-grid-column binding="browser" header="Browser">
            <ng-template wjFlexGridCellTemplate [cellType]="'Cell'" let-cell="cell">
                <img *ngIf="cell.item.browser == 'Chrome'" src="../../assets/chrome.png" alt="" height="16">
                <img *ngIf="cell.item.browser == 'Firefox'" src="../../assets/firefox.png" alt="" height="16">
                <img *ngIf="cell.item.browser == 'Edge'" src="../../assets/edge.png" alt="" height="16">
                <img *ngIf="cell.item.browser == 'Safari'" src="../../assets/safari.png" alt="" height="16">
                <i *ngIf="cell.item.browser == 'Other'" class="bi bi-cloud-fill"></i>
                {{cell.item.browser}}
            </ng-template>
        </wj-flex-grid-column>
    </wj-flex-grid>
    <br>
    <wj-collection-view-navigator headerFormat="Page {currentPage:n0} of {pageCount:n0}" [byPage]="true" [cv]="selectedCountryData"> </wj-collection-view-navigator>
</div>
FlexGrid 및 CollectionViewNavigator라는 두 가지 컨트롤을 설정하겠습니다.
FlexGrid의 경우 wj-flex-grid 태그를 사용하여 컨트롤 자체를 만든 다음, wj-flex-grid-column 태그를 사용하여 표시될 각 열을 만듭니다.
일반적으로 각 개별 열을 설정할 필요는 없지만 FlexGridCellTemplate을 사용하여 일부 셀의 스타일을 지정하는 데 도움이 되도록 일부 템플릿을 사용할 것입니다.
플랫폼(Platform) 및 브라우저(Browser) 열 내에서 ng-template 요소를 생성합니다.
FlexGridCellTemplate 컨트롤은 이를 사용하여 해당 열에 있는 셀 내부의 스타일을 지정합니다.
각 셀 안에 표시하려는 마크업을 포함할 수 있습니다.
표시하려는 마크업은 셀 내의 값에 따라 달라지므로 *ngIf를 사용하여 셀 값을 선별한 다음, 표시하려는 마크업을 선택합니다.
CollectionViewNavigator를 사용하면 FlexGrid에 페이지 매김을 포함할 수 있습니다.
이 기능이 작동하기 위해서는 그리드가 사용하는 것과 동일한 CollectionView를 제공해야 합니다.
그러면 FlexGrid와 CollectionViewNavigator 모두 CollectionView에 액세스할 수 있습니다.
컨트롤 중 하나에 의해 CollectionView에 적용된 모든 변경 사항은 페이징 적용 기능을 포함하여 두 컨트롤 모두에 본떠집니다.
다음으로 user-info.component.css 파일에 이동하여 스타일을 적용하겠습니다.
.users-container {
    padding: 1rem;
}

.users-header {
    font-size: 1.05em;
    color: gray;
}

.wj-flexgrid {
    max-height: 440px;
    margin-top: 10px;
}

@media (max-width: 799px) {
    .wj-collectionview-navigator {
        width: 300px;
    }
}
여기에서 우리가 수행할 작업은 헤더의 패딩(padding: 테두리와 콘텐츠 사이에 있는 여백) 및 글꼴 크기를 설정하고, FlexGrid 컨트롤에서 너비와 여백을 설정합니다.
추가적으로 화면 크기가 800px보다 작을 때 CollectionViewNavigator에서 너비를 설정하기만 하면 됩니다.
다음은 데이터를 채우기 위한 TypeScript를 만드는 것입니다.
이는 FlexGrid 컨트롤에 전달하여 채우는 데 사용할 데이터 수집을 처리하는 기능을 제공합니다.
user-info.component.ts 파일 내에서 진행합니다.
import {
  Component,
  Input,
  OnInit,
  OnChanges,
  SimpleChanges,
} from '@angular/core';

import { DataService } from '../data.service';
import * as wjCore from '@grapecity/wijmo';

@Component({
  selector: 'app-user-info',
  templateUrl: './user-info.component.html',
  styleUrls: ['./user-info.component.css']
})
export class UserInfoComponent implements OnInit, OnChanges {
  @Input('selectedCountryName') selectedCountryName: string;
  selectedCountryData: wjCore.CollectionView;
  usersTooltip = 'Information on the last 200 users from selected country.';

  constructor(private dataService: DataService) {
    this.selectedCountryData = new wjCore.CollectionView(dataService.getCountryInfo('United States'), {
      pageSize: 25
    })
  }

  ngOnInit(): void {}

  ngOnChanges(changes: SimpleChanges): void {
    if(changes.selectedCountryName.currentValue && this.dataService.isValidCountry(changes.selectedCountryName.currentValue)) {
      this.selectedCountryData = new wjCore.CollectionView(this.dataService.getCountryInfo(changes.selectedCountryName.currentValue), {
        pageSize: 25
      });
    }
  }
}
data.service.ts 파일에 코드를 추가해야 합니다.
getCountryInfo(country: string) {
    var data = [],
      platforms = ['Desktop', 'Mobile', 'Tablet', 'Other'],
      browsers = ['Chrome', 'Firefox', 'Edge', 'Safari', 'Other'];
    for (var i = 0; i < 200; i++) {
      data.push({
        country: country,
        sessionDuration:
          Math.round(Math.random() * 7) +
          'm ' +
          Math.round(Math.random() * 60) +
          's',
        ipAddress:
          Math.round(Math.random() * (999 - 1) + 1) +
          '.' +
          Math.round(Math.random() * (999 - 1) + 1) +
          '.' +
          Math.round(Math.random() * (999 - 1) + 1) +
          '.' +
          Math.round(Math.random() * (999 - 1) + 1),
        platform: platforms[Math.round(Math.random() * 3)],
        browser: browsers[Math.round(Math.random() * 4)],
      });
    }
    return data;
  }
* 일부 사용자에게 인덱스 서명 오류가 발생할 수도 있습니다.
해당 오류가 발생하는 경우, tsconfig.json 파일을 다음과 같이 업데이트하여 빠르게 해결하실 수 있습니다.
"noPropertyAccessFromIndexSignature": false
컴포넌트 생성이 모두 끝났다면 app.component.html 파일에 추가해야 합니다.
<div class="livemap user-info">
    <app-user-info></app-user-info>
  </div>
FlexMap 컴포넌트에서 내보내는 국가 이름인 @Input 값, CollectionView 및 사용자에게 해당 카드의 용도를 알리는 데 사용하는 Tooltip이 있습니다.
다음으로 CollectionView의 pageSize 속성에 값을 할당합니다.
이는 페이지당 표시될 행 수(이 경우 25행의 데이터)를 결정합니다.
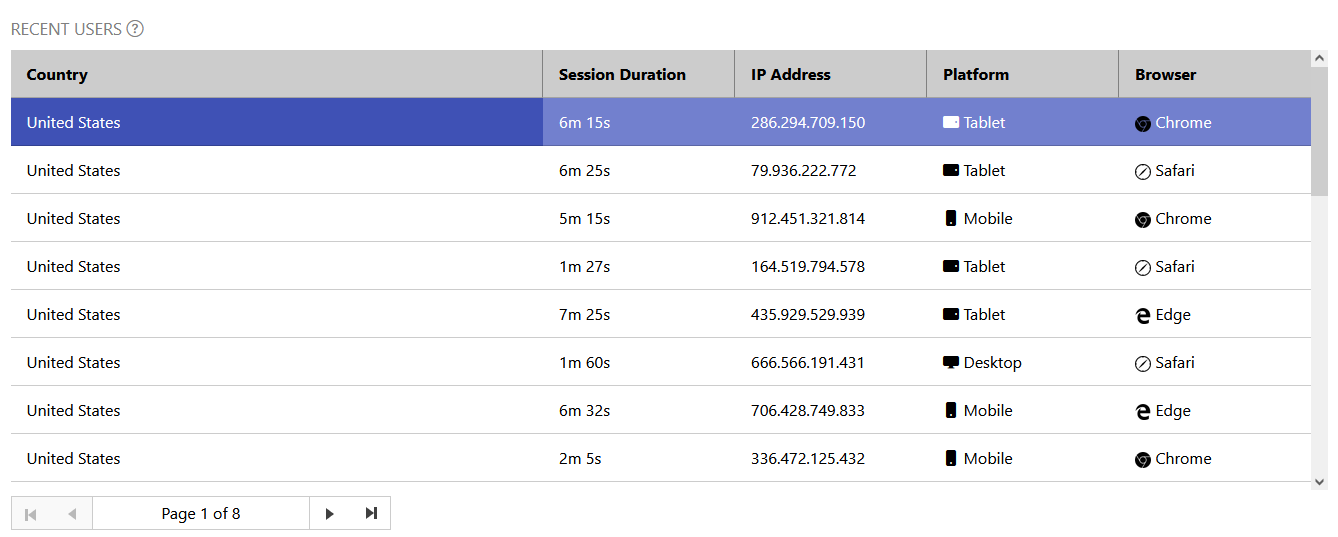
실행 시 FlexGrid는 다음과 같이 표시됩니다.
issue-info 컴포넌트로 이동하여 코드를 작성하겠습니다.
먼저, issue-info.component.html 파일에 마크업을 생성합니다.
<div class="issues-container">
    <div class="issues-header">ISSUES REPORTED <i class="bi bi-question-circle" [wjTooltip]="issuesTooltip" [wjTooltipPosition]="6"></i></div>
    <wj-flex-grid #issueGrid [itemsSource]="selectedCountryData" [isReadOnly]="true" [selectionMode]="'Row'" [headersVisibility]="'Column'" [lazyRender]="false" (initialized)="initializedGrid(issueGrid)">
        <wj-flex-grid-column binding="country" header="Country" [width]="'*'"></wj-flex-grid-column>
        <wj-flex-grid-column binding="issue" header="Issue" [width]="'*'"></wj-flex-grid-column>
        <wj-flex-grid-column binding="status" header="Status" [width]="'*'">
            <ng-template wjFlexGridCellTemplate [cellType]="'Cell'" let-cell="cell">
                <span *ngIf="cell.item.status == 'High'" class="badge bg-danger">{{ cell.item.status }}</span>
                <span *ngIf="cell.item.status == 'Moderate'" class="badge bg-warning text-dark">{{ cell.item.status }}</span>
                <span *ngIf="cell.item.status == 'Low'" class="badge bg-info text-dark">{{ cell.item.status }}</span>
            </ng-template>
        </wj-flex-grid-column>
    </wj-flex-grid>
</div>
기본적으로 user-info 컴포넌트의 마크업과 동일합니다.
FlexGrid 컨트롤을 만들고, wj-flex-grid-column 태그를 사용하여 열을 생성합니다.
FlexGridCellTemplate을 사용하여 사용자 정의 콘텐츠가 포함된 열을 만듭니다.
issue-info.component.css 파일로 이동해 CSS를 추가하겠습니다.
.issues-container {
    padding: 1rem;
}

.issues-header {
    font-size: 1.05em;
    color: gray;
}

.wj-flexgrid {
    max-height: 480px;
    margin-top: 10px;
}
다른 컴포넌트와 마찬가지로 글꼴 크기, 패딩(padding: 테두리와 콘텐츠 사이에 있는 여백) 및 FlexGrid 크기를 설정합니다.
다음은 data.service.ts 파일을 업데이트해야 합니다 .
reportedIssues = [
    { country: 'United States', issuesReported: 72 },
    { country: 'Canada', issuesReported: 35 },
    { country: 'Mexico', issuesReported: 24 },
    { country: 'Brazil', issuesReported: 7 },
    { country: 'Peru', issuesReported: 2 },
    { country: 'United Kingdom', issuesReported: 29 },
    { country: 'France', issuesReported: 19 },
    { country: 'Germany', issuesReported: 15 },
    { country: 'Spain', issuesReported: 9 },
    { country: 'Italy', issuesReported: 6 },
    { country: 'Netherlands', issuesReported: 4 },
    { country: 'Finland', issuesReported: 7 },
    { country: 'Denmark', issuesReported: 9 },
    { country: 'Norway', issuesReported: 14 },
    { country: 'Poland', issuesReported: 3 },
    { country: 'Russia', issuesReported: 11 },
    { country: 'Ukraine', issuesReported: 8 },
    { country: 'China', issuesReported: 18 },
    { country: 'Japan', issuesReported: 17 },
    { country: 'Australia', issuesReported: 7 },
  ];

  getIssueData(country: string) {
    var issues = [
        {
          issue: '500 Internal Server Error',
          status: 'High',
          message: 'General purpose error: potential server overload',
        },
        {
          issue: '400 Bad Request',
          status: 'High',
          message: 'Browser error: corrupted request',
        },
        {
          issue: '408 Request Time-Out',
          status: 'High',
          message: 'Slow response time: check server request',
        },
        {
          issue: '403 Forbidden',
          status: 'Moderate',
          message:
            'Refused access: user attempted to access forbidden directory',
        },
        {
          issue: '501 Not Implemented',
          status: 'Moderate',
          message: 'Request refused: unsupported browser feature',
        },
        {
          issue: '401 Unauthorised',
          status: 'Low',
          message: 'Login failed: user does not have access',
        },
        {
          issue: '404 Not Found',
          status: 'Low',
          message: 'Page not returned: check status of requested page',
        },
      ],
      data = [];
    for (var i = 0; i < this.reportedIssues.length; i++) {
      if (this.reportedIssues[i].country == country) {
        for (var j = 0; j < this.reportedIssues[i].issuesReported; j++) {
          var selector = Math.round(Math.random() * 6);
          data.push({
            country: country,
            issue: issues[selector].issue,
            status: issues[selector].status,
            message: issues[selector].message,
          });
        }
        break;
      }
    }
    return data;
  }
Issue-info.component.ts 파일로 이동하여 TypeScript 코드를 구현합니다.
import {
  Component,
  OnInit,
  Input,
  OnChanges,
  SimpleChanges,
} from '@angular/core';

import * as wjCore from '@grapecity/wijmo';
import * as wjGrid from '@grapecity/wijmo.grid';
import { DataService } from '../data.service';

@Component({
  selector: 'app-issue-info',
  templateUrl: './issue-info.component.html',
  styleUrls: ['./issue-info.component.css'],
})
export class IssueInfoComponent implements OnInit, OnChanges {
  @Input('selectedCountryName') selectedCountryName: string;
  selectedCountryData: wjCore.CollectionView;
  issuesTooltip = 'Issues reported by system';

  constructor(private dataService: DataService) {
    this.selectedCountryData = new wjCore.CollectionView(dataService.getIssueData('United States'));
  }

  ngOnInit(): void {
  }

  ngOnChanges(changes: SimpleChanges): void {
    if(changes.selectedCountryName.currentValue && this.dataService.isValidCountry(changes.selectedCountryName.currentValue)) {
      this.selectedCountryData = new wjCore.CollectionView(this.dataService.getIssueData(changes.selectedCountryName.currentValue));
    }
  }

  initializedGrid(grid: wjGrid.FlexGrid) {
    let toolTip = new wjCore.Tooltip();
    grid.formatItem.addHandler((s: wjGrid.FlexGrid, e: wjGrid.FormatItemEventArgs) => {
      if(e.panel == s.cells) {
        let item = s.rows[e.row].dataItem, binding = s.columns[e.col].binding, note = item.message;
        if(e.col == 1) {
          wjCore.toggleClass(e.cell, 'wj-has-notes', true);
          toolTip.setTooltip(e.cell, '<b>Error:</b><br/>' + note);
        }
      }
    });
    grid.updatingView.addHandler(() => {
      toolTip.dispose();
    });
  }

}
해당 코드는 user-info TypeScript 코드와 동일하며 이곳에 하나의 새로운 메서드가 추가됩니다.
바로 initializedGrid() 메소드입니다.
그리드에 Tooltip을 통합할 것이며 initializedGrid() 메소드를 사용할 것입니다 .
그리드의 formatItem 이벤트에 메서드를 할당하고 이 이벤트 내에서 그리드의 두 번째 열에 있는지 확인합니다.
* 배열 인덱싱은 0에서 시작하기 때문에 열 값은 1이 됩니다.
다음으로 해당 셀에 1부에서 생성한 wj-has-notes 클래스 및 사용자가 셀을 가리키면 표시될 일부 HTML을 할당합니다.
마지막으로 app.component.html 파일 내부에 issue-info 컴포넌트를 추가하면 됩니다.
<div class="livemap issue-info">
<app-issue-info></app-issue-info>
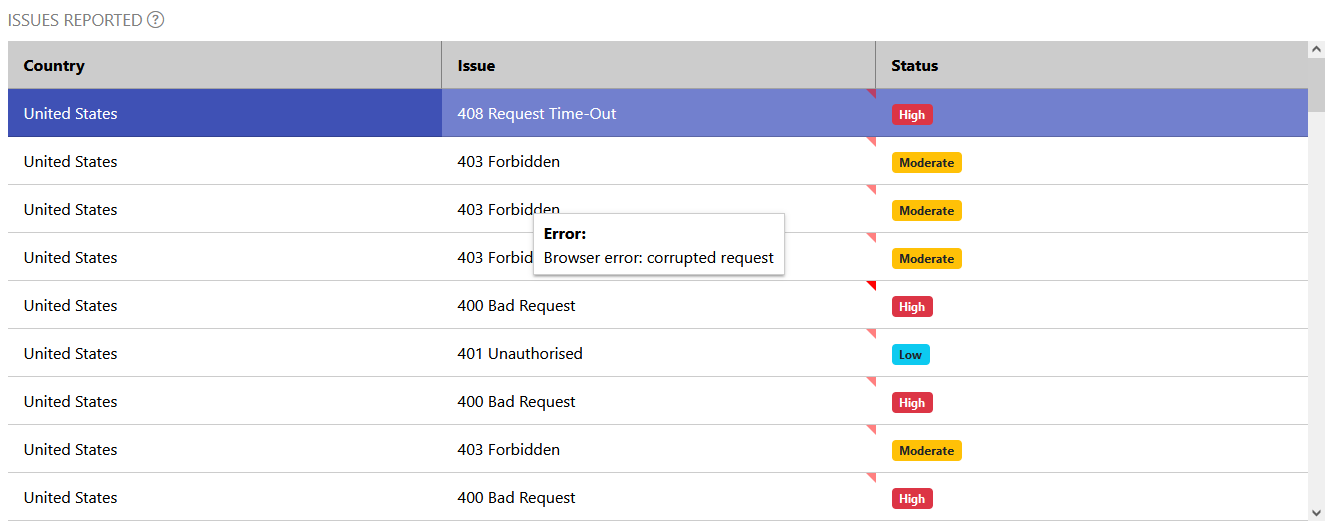
</div>코드를 실행하면 Tooltip 알리미, 사용자 정의 콘텐츠를 포함한 FlexGrid가 렌더링되는 것을 볼 수 있습니다.
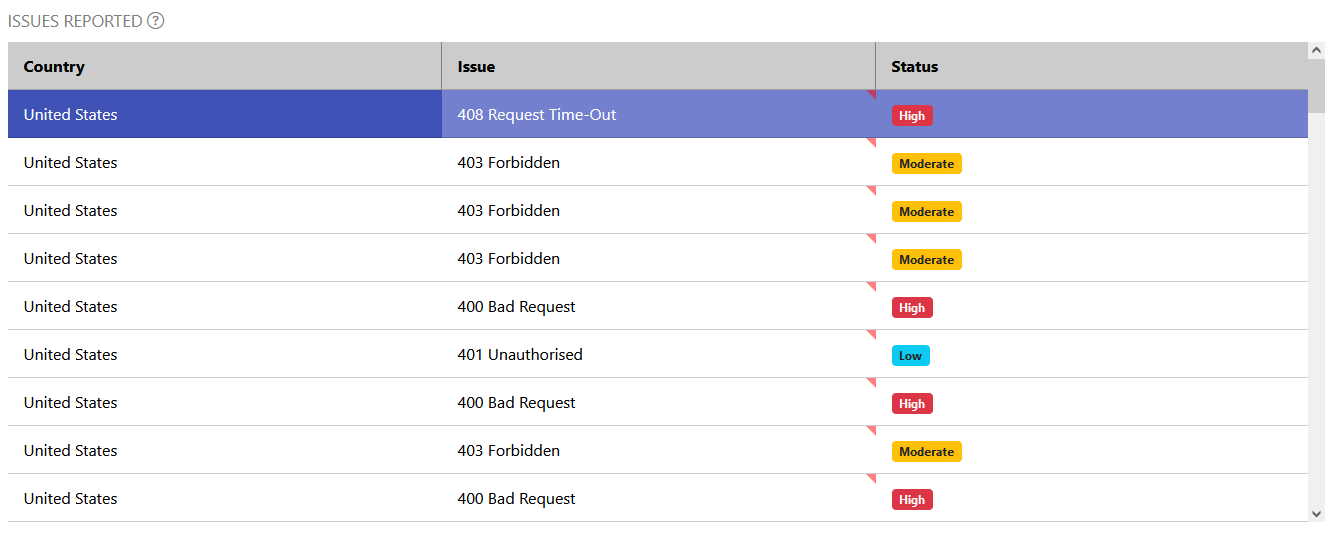
사용자가 Tooltip이 포함된 셀 중 하나 위로 마우스를 가지고 가면 Tooltip이 표시됩니다.
결론
대시보드 응용 프로그램이 완성되었습니다!
실행하면 브라우저에 다음과 같은 화면이 표시됩니다.
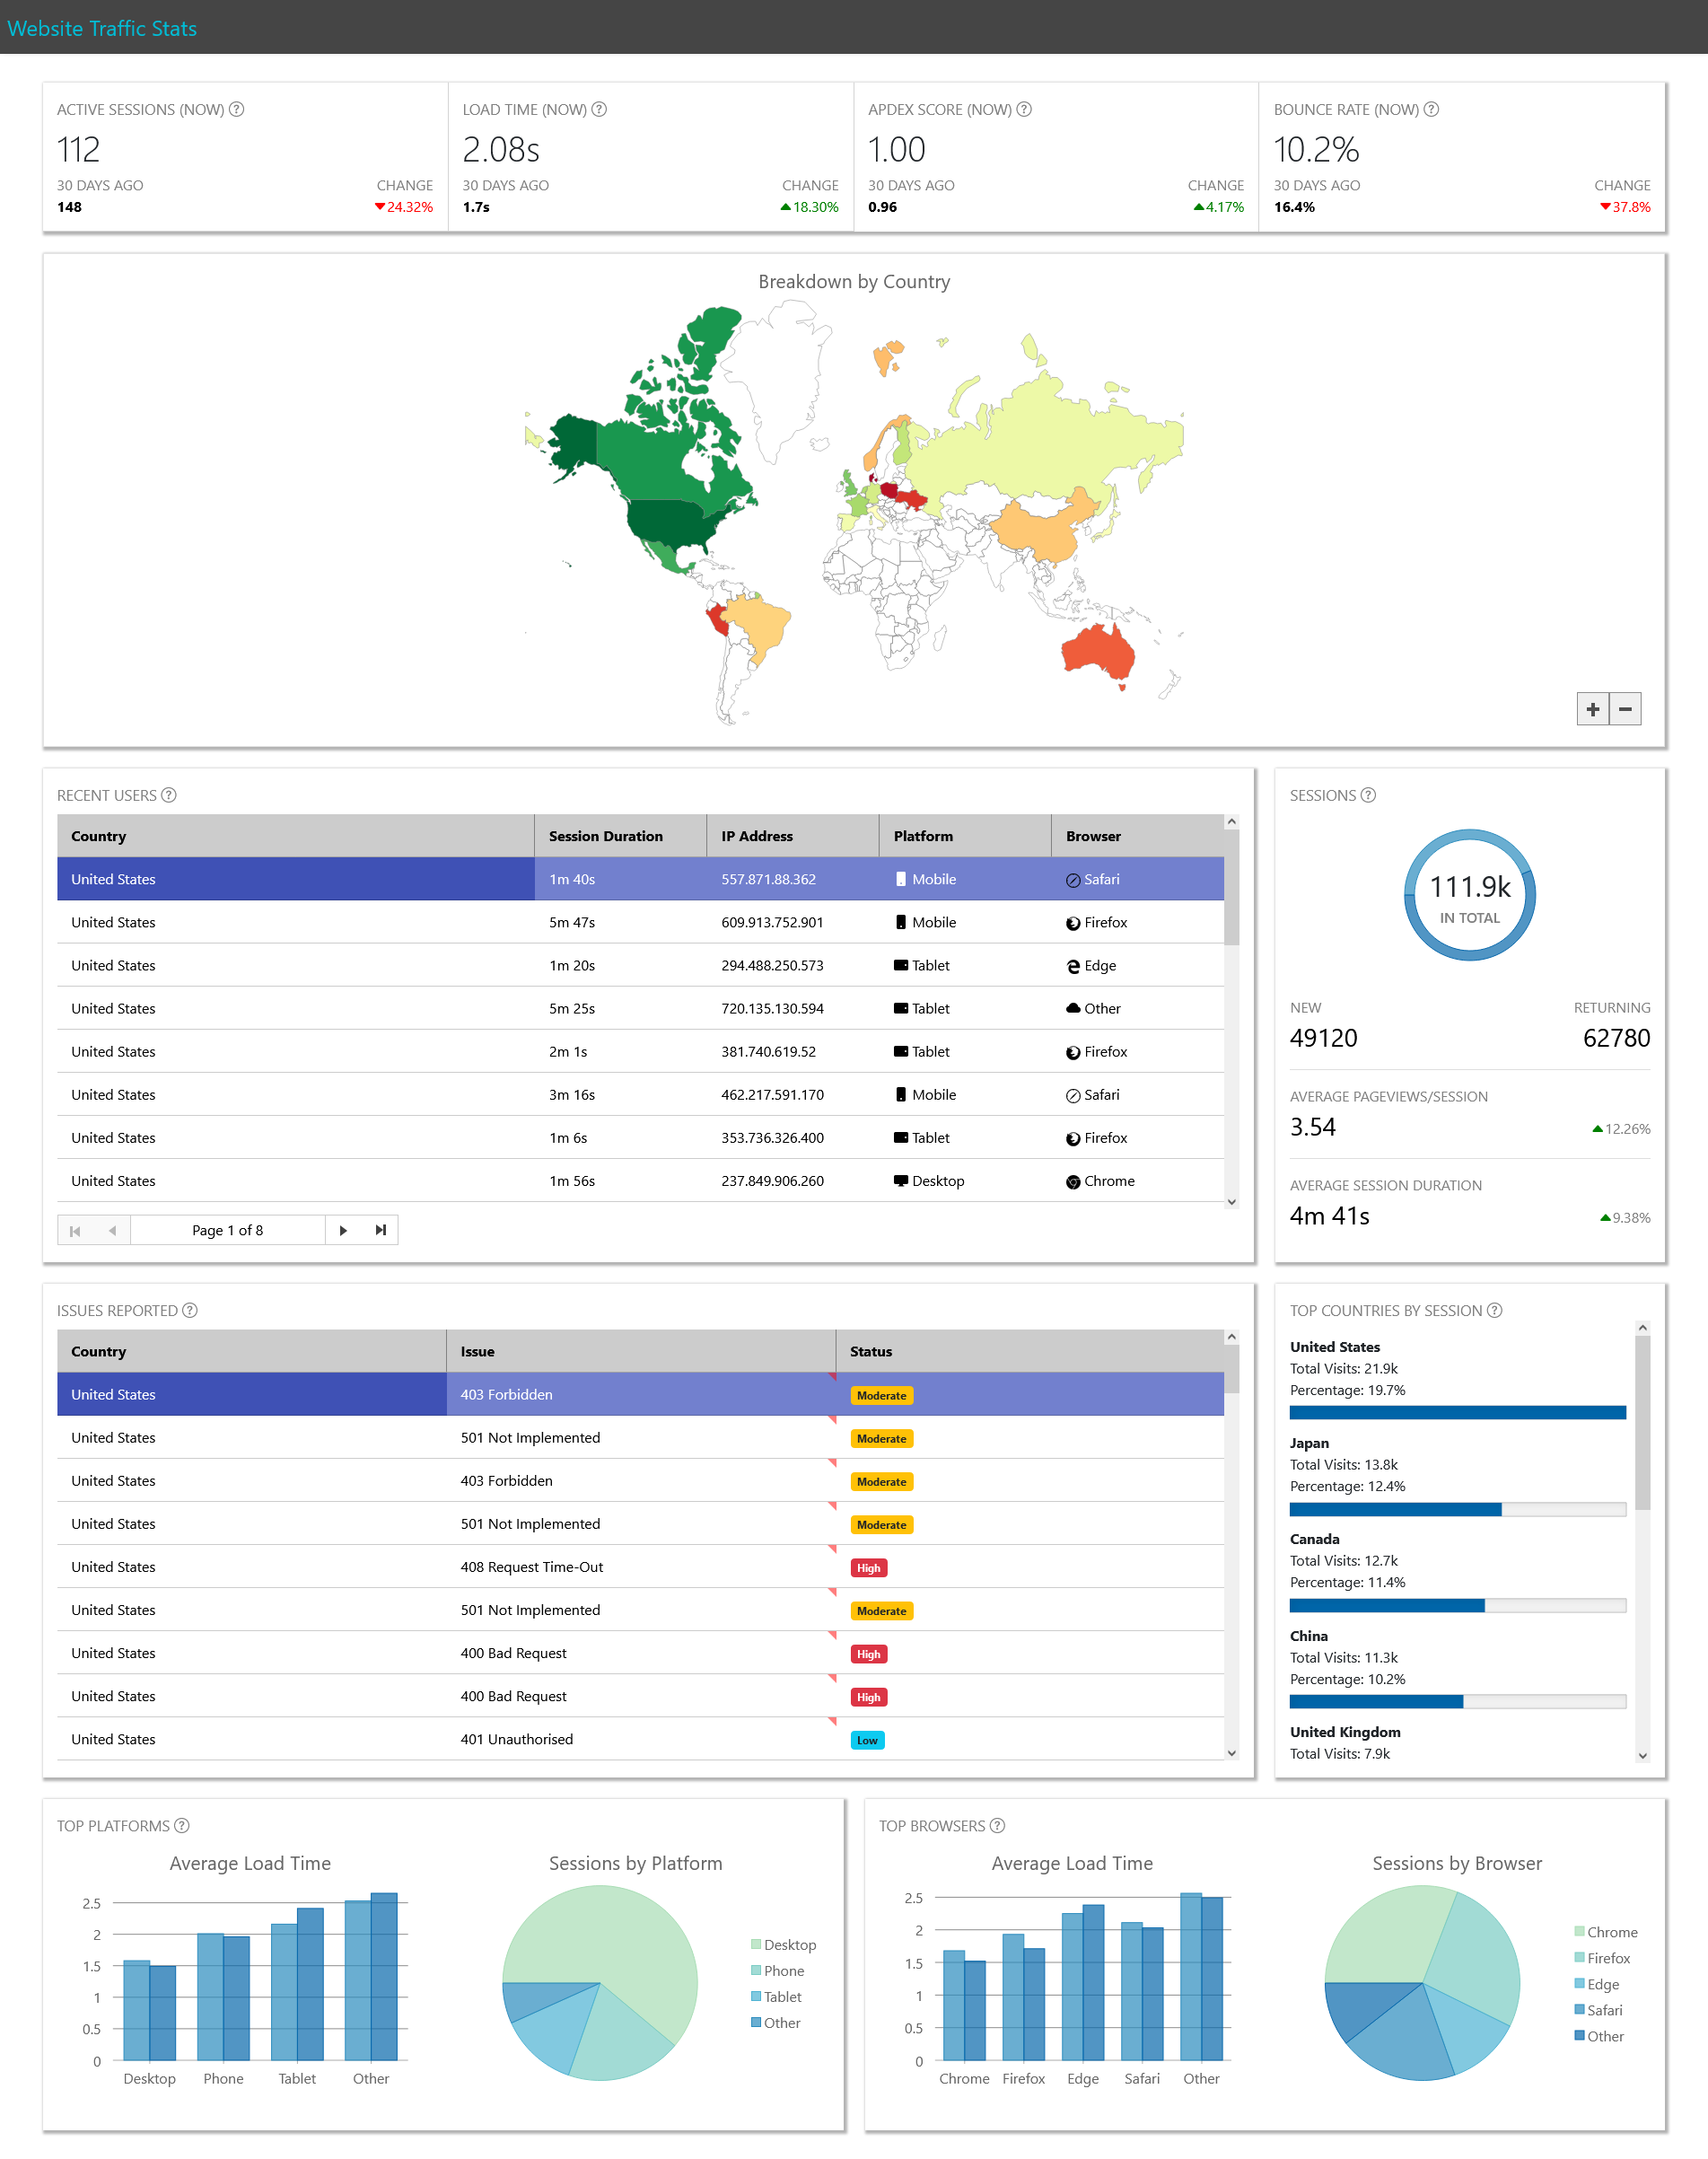
우리가 수행했던 작업들을 다시 한 번 더 살펴보겠습니다.
- 다양한 컨트롤을 보유한 반응형 카드 집합 생성
- 활성 세션 수, 사이트 로드 시간, APDEX 스코어, 이탈률에 대한 통계를 표시하는 컴포넌트 구현
- FlexPie 및 FlexChart를 사용하여 세션 정보, 플랫폼 별 로드 시간/세션, 브라우저 별 로드 시간/세션 표시
- 세션별 상위 국가 목록을 표시하는 Gauge(게이지) 생성
- FlexMap을 이용한 로드 시간 기준 사이트를 방문하는 사용자와 함께 국가를 표시하는 색상 척도를 사용하여 세계의 등치 지도(Choropleth Map) 생성
* 등치 지도(Choropleth Map) : 유사 색상을 사용하여 공간 열거 내에서 지리적 특징을 나타내는 일종의 통계 주제 지도 - FlexMap 컨트롤을 두 개의 FlexGrid 컨트롤에 연결하여 사용자에 대한 데이터와 사용자가 사이트와 상호 작용할 때 겪게 되는 문제 표시
사용자에게 상당한 양의 정보를 제공하는 깔끔한 대시보드가 완성되었습니다.
우리가 작성한 CSS를 사용하면 대시보드를 반응형으로 만들 수 있으며, 대시보드에 액세스하는 모든 기기에서 읽을 수 있습니다.
대시보드는 여러 산업 분야에서 데이터 분석의 중요한 수단이 되었습니다. 사용자는 대시보드를 통해 자신의 정보를 기반으로 높은 수준의 비즈니스 결정을 신속하게 내릴 수 있습니다.
Wijmo를 사용하면 개발자는 정보를 보는 다양한 방법에 대해 신속하고 다양한 컨트롤을 쉽게 구현할 수 있으며, 컨트롤을 데이터 소스에 연결하고, 기업에서 활용 가능한 대시보드를 준비할 수 있습니다.
브라우저에서 응용 프로그램을 실행하고, 소스 코드를 확인해 보시길 바랍니다!
지금 바로 Wijmo를 다운로드하여 직접 테스트해 보세요!

댓글목록
등록된 댓글이 없습니다.