비니아빠 님, 안녕하세요.
메시어스입니다.
1. 그래프 위에 숫자값을 나타내는 법
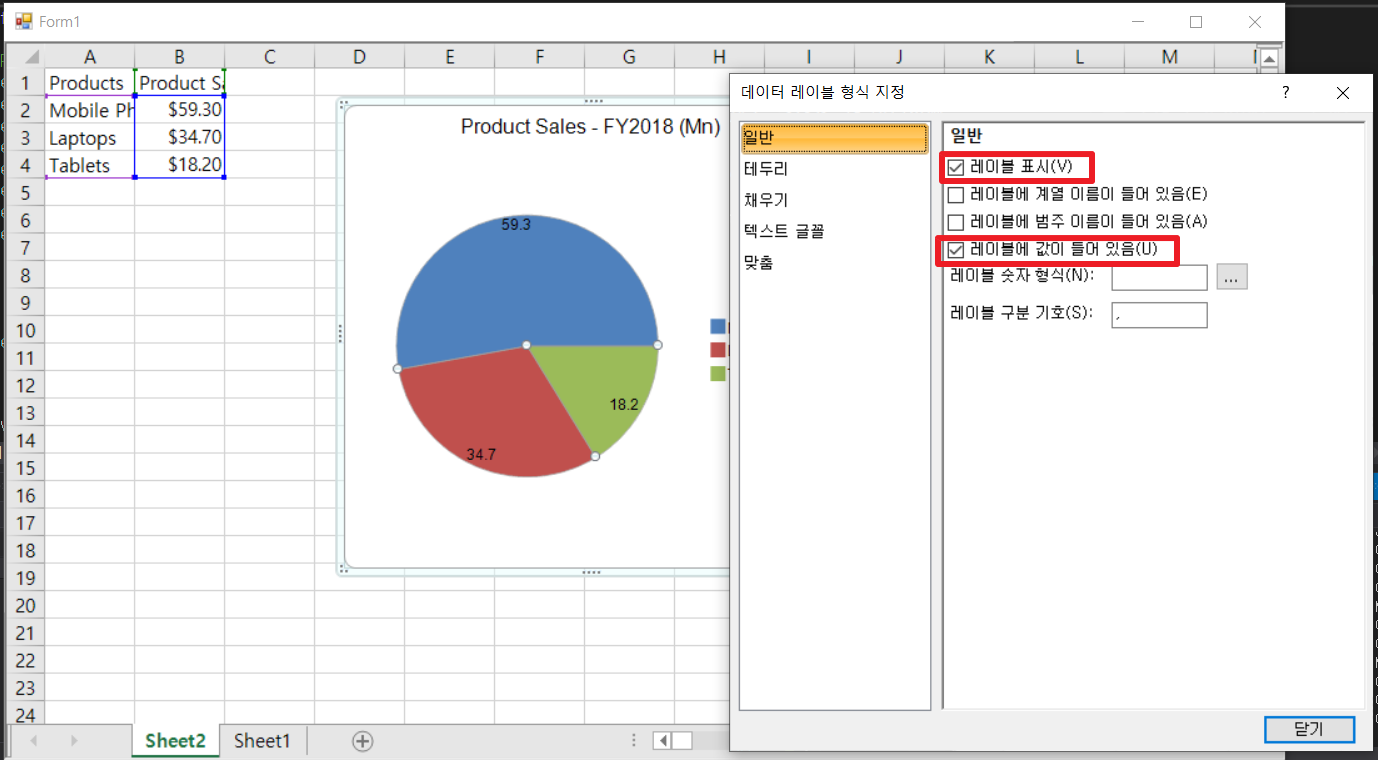
데이터 레이블에 값을 포함되게 하고 데이터 레이블을 표시하게 함으로써, 차트 위에 데이터 값(숫자값)을 나타낼 수 있습니다. 아래 샘플 코드에서 LabelVisible 속성과 LabelContainsValue 속성이 true로 설정되어 있을 때의 동작을 확인하실 수 있습니다.
// Pie Chart 생성
fpSpread1.Sheets[0].Cells[0, 0].Text = "Products";
fpSpread1.Sheets[0].Cells[1, 0].Text = "Mobile Phones";
fpSpread1.Sheets[0].Cells[2, 0].Text = "Laptops";
fpSpread1.Sheets[0].Cells[3, 0].Text = "Tablets";
fpSpread1.Sheets[0].Cells[0, 1].Text = "Product Sales - FY2018 (Mn)";
fpSpread1.Sheets[0].Cells[1, 1].Value = 59.3;
fpSpread1.Sheets[0].Cells[2, 1].Value = 34.7;
fpSpread1.Sheets[0].Cells[3, 1].Value = 18.2;
FarPoint.Win.Spread.CellType.CurrencyCellType currencycell = new FarPoint.Win.Spread.CellType.CurrencyCellType();
currencycell.DecimalPlaces = 2;
currencycell.ShowCurrencySymbol = true;
currencycell.CurrencySymbol = "$";
fpSpread1.Sheets[0].Cells[1, 1, 3, 1].CellType = currencycell;

FarPoint.Win.Spread.Chart.SpreadChart chart = fpSpread1.Sheets[0].AddChart(0, 0, typeof(FarPoint.Win.Chart.PieSeries), 400, 370, 240, 30);
FarPoint.Win.Chart.PieSeries series = (FarPoint.Win.Chart.PieSeries)chart.Model.PlotAreas[0].Series[0];
series.LabelVisible = true;
series.LabelContainsValue = true;
- Spread Winforms V12 | Creating a Pie Plot
2. 2가지 값을 넣어서 도우넛 그래프로 나타내는법을 알고싶어요.
정확한 안내를 위해 2가지 값이 포함된 도우넛 그래프에 대한 디테일한 설명을 부탁드립니다.
두 가지 데이터를 이용하여 이중 도넛 차트를 만들고 싶으신 것일까요? 혹은 1번과 같이 데이터 레이블을 표시할 때, 범주 이름과 값을 함께 표시하는 것을 말씀하시는 것일까요?
표현하시고자 하는 차트의 이미지를 함께 공유해주시면, 적용 가능한 방법이 있는지 확인 후 안내드리겠습니다.
감사합니다.
메시어스 드림


 작성일 2024-03-07 11:12 조회 37회
댓글 1건
작성일 2024-03-07 11:12 조회 37회
댓글 1건

 1 답변
1 답변